IDEALVis: Intelligent Data Exploration and Adaptive MeaningfuL Visualizations
The goal of the IDEALVis project is to enable human-centered adaptive data visualizations that will facilitate more efficient and effective data exploration and analysis of complex and multivariate business datasets, in order to enable more effective decision making on critical business tasks.
The project is partially funded by the European Regional Development Fund (ERDF), Republic of Cyprus, Structural Funds of the European Union in Cyprus and the Cyprus Research and Innovation Promotion Foundation.




IDEALVis objectives
Go beyond the state of the art in adaptive data visualization and personalization techniques
The combined project outcomes will generate new knowledge with regards to the consideration of individual differences in information processing as the core ingredient of the adaptation and personalization process of the related methods, tools and services.
Identify potential correlations of cognitive factors with data visualizations
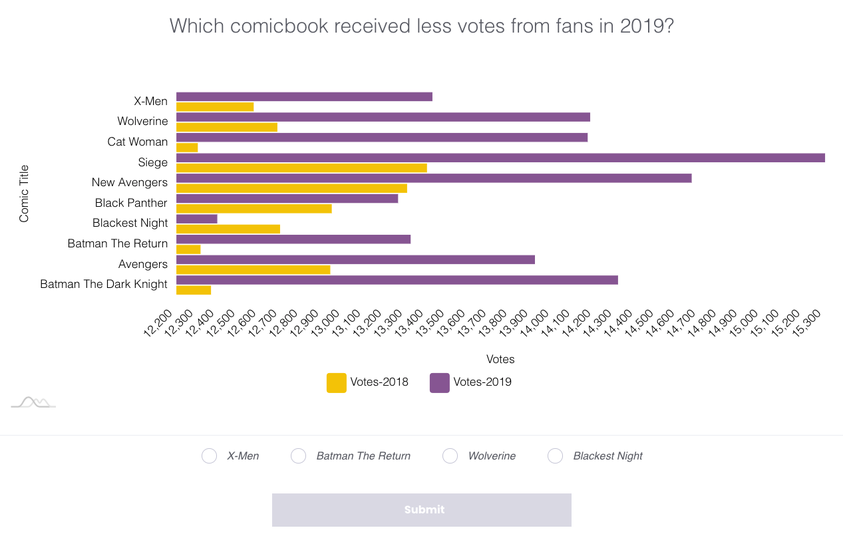
Through a number of ecological valid experimental user studies that will be carried out iteratively throughout the life-cycle of the project, the research team will explore potential correlations of cognitive factors referring to high-level information processes as well as elementary cognitive processes with different kinds of data visualizations, in terms of type and complexity (e.g., network diagrams, area and radar graphs, bar and line charts).
Create a set of practical design guidelines
The project will create a set of innovative practical design guidelines suggesting how visual analytics can be enriched with personalization techniques and adaptive interventions and produce alternative interactive data visual designs that consider user’s individual differences as the core filtering parameters.
Develop a novel multi-dimensional human-centered user model
The project will define and develop a comprehensive model that quantifies cognitive factors related to information processing, decision making, problem solving and learning, domain expertise, and experience. The proposed user model will be created using psychometric tools embedded to the framework and real time tests and will be further validated with external devices such as the use of an eye-tracking system.
Quantify the User Experience and understand patterns in the interaction process
The objective is to quantify the user experience, analyze it using machine learning techniques and identify effective practices in exploratory data analysis. This in turn will produce a well- informed approach to exploratory data analysis. To inform the guidance process to the desired knowledge, the project will capture navigation patterns, resulting in an assessment and recommendation on the efficiency of the process, such as time for completion, suggested routes and experiences of users that share the same role, characteristics or expertise.
Evaluate the IDEALVis platform with real end-users
One of the main objectives of the project is to design, organize, and conduct one pilot trial, in order to evaluate and assess the platform’s usability and robustness in a real-life business setting using real datasets from at least two business domains provided by the end-user organizations (e.g., retail audit). This includes information on multiple dimensions, such as product, brand, distributor manufacturer and multiple metrics such as sales, sales volume, sales trends, stock levels, promotion efforts, and other associated aspects. The pilot trial will validate the efficiency and effectiveness of the proposed adaptive interventions and rules and will also improve the robustness of the proposed platform.
develop an intelligent data analytics component that enhances the efficiency and effectiveness of the data exploration process
The project will explore techniques that allow users to reflect on their data exploration experiences and improve their practices, utilize existing knowledge and identify effective practices in the organization.
Design a set of novel personalization rules and adaptive interventions for data visualizations
The analysis of the impact of cognitive factors, domain expertise, and experience on understanding visualizations will yield a set of rules that recommend the best-fit data visualizations to the end-users by altering their structure and semantics (e.g., altering the type, complexity, proximity of graph entities, order of elements, density of colors, salience, proportion shifts, etc.).
Design and develop an open and flexible user-centered adaptive data visualizations framework
The project will design, develop and evaluate the IDEALVis framework that will dynamically adjust the content and interaction style of data visualizations based on users’ individual differences, the data characteristics (e.g., criticality, real-time, historical) and the task at hand (e.g., priority, time constraints).
Like Our Vision? Want to get involved? Drop us an Email
Partners

InSPIRE
Host Organization
KPMG
Partner
RAI Consultants
PartnerPeople
News
We are seeking an outstanding and highly motivated PhD candidate to join the InSPIRE team for the IDEALVis project.
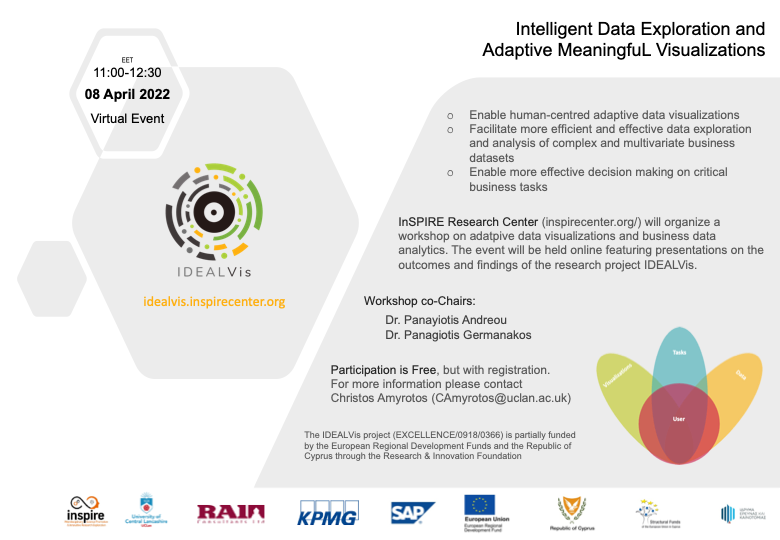
More details hereJoin us in this online Workshop where we will demonstrate the most important outcomes and findings of the IDEALVis research project.
Download InvitationProject Deliverables
D03 - Consortium Meetings Report
DownloadD04 - Dissemination Plan
DownloadD05 - Project Website
DownloadD06 - Press Release
DownloadD07 - Workshop Organization
DownloadD08 - Exploitation Plan
DownloadD09 - Survey on Adaptive Data Visualization Techniques for Business Data Analytics
DownloadD10 - Requirements Analysis and Specification
DownloadD11 - The Impact of Cognitive Factors on Data Visualizations
DownloadD12 - The Human-centred User Model for Adaptive Data Visualizations
DownloadD13 - Guided Reflective Exploratory Analysis
DownloadD14 - Effective Practice Discovery using Collective Intelligence in Business Analytics
DownloadD15 - IDEALVis Adaptation Engine
DownloadD16 - Design and Development of the IDEALVis adaptation engine
DownloadD17 - Design and Development of the Service Manager
DownloadD18 - Specification of overall platform architecture
DownloadD19 - Development of KnowledgeBase
DownloadD20 - Development of the Operational Platform
DownloadD21 - Platform Validation
DownloadD22 - Trial and Evaluation Design
DownloadD23 - Pilot setup and deployment
DownloadD24 - Overall Platform Evaluation
DownloadProject Publications
We are pleased to announce that our paper with title "Adaptive Business Data Visualizations and Exploration: A Human-centred Perspective" was accepted for publication in the 5th HUMANIZE workshop hosted by Intelligent User Interfaces (IUI) 2021.
Publication Link: https://dl.acm.org/doi/abs/10.1145/3397482.3450708 Video Presentation: https://www.youtube.com/watch?v=Aijoo3QvAy0
We are pleased to announce that our paper with title "Human-centred Persona Driven Personalization in Business Data Analytics" was accepted for publication in the 6th HAAPIE Workshop hosted by ACM User Modeling, Adaptation and Personalization (ACM UMAP) 2021.
Publication Link: https://dl.acm.org/doi/10.1145/3450614.3462241 Video Presentation: https://www.youtube.com/watch?v=gWCq_zZFXNE&t=180s
We are pleased to announce that our paper with title "Proposing a Perceived Expertise Tool in Business Data Analytics" was accepted for publication in the 6th HAAPIE Workshop hosted by ACM User Modeling, Adaptation and Personalization (ACM UMAP) 2021.
Publication Link: https://dl.acm.org/doi/10.1145/3450614.3462236


